Key Internet Statistics to Know in 2020 (Including Mobile) | Estadísticas clave de Internet para saber en 2020 (incluido el móvil)
Each year the internet grows and 2020 will be no different.
From social media to video consumption, search terms, and ecommerce, you can do just about anything online.
With this post, we’ve compiled the most relevant 2020 internet statistics to serve as a reference for information, projects, blog posts, and more, about all of those topics above.
We hope you find this information useful and we will continue to update this post as statistics become outdated, updated, or changed.
2020 General Internet Usage Statistics
 With a current world estimated population of 7.8 billion, there are approximately 4.79 billion people worldwide who have access to and use the internet frequently. That means that 61.4% of the world population uses the internet.
From the year 2000 to 2019, the usage of the internet increased by 1,157%.
As of June 2019, the world region of Asia accounts for the majority of internet users in the world. 2,300,469,859 people in Asia are online, which makes up 50.7% of the global internet population.
89.4% of America and 87.7% of Europe has access to and uses the internet on a daily basis. Both regions have some of the highest internet penetration rates.
Countries in the Middle East have seen a 5,243% growth in internet usage since 2010.
There are currently 351.8 million registered domain names in the world.
35% of all websites are using WordPress as their content management system. That’s over 60 million websites.
The most common domain name extensions are:
.com
.net
.org
.co
.us
https://www.broadbandsearch.net/blog/internet-statistics
In 2019, the number of emails sent and received globally was 293.6 billion per day. By 2022, it’s expected to increase to 333.2 billion emails sent and received per day.
Every minute, Americans generate 3,138,420gb of internet traffic 2019 Internet Traffic Statistics
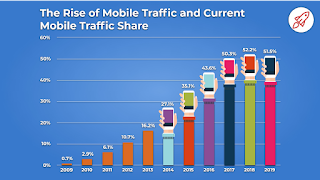
In 2019, 51.5% of all traffic worldwide was conducted on mobile phone devices. This is slightly lower than the year before, suggesting the trend will settle at around 50 percent of traffic coming from mobile.
In 2009, just 0.7% of internet traffic worldwide was from mobile devices.
64.92% of people browsing the internet are using Google Chrome as their main browser.
15.97% of people browsing the internet are using Safari to do it
4.33% of internet users choose Firefox as their main browser
The top 10 most visited sites on the web in 2019 were:
1. Google
2. YouTube
3. Tmall
4. Facebook
5. Baidu
6. Tencent QQ
7. Sohu
8. Taobao
9. 360.cn
10. Jd.com
As compared to 2018, Google and YouTube remained in the same positions. But Facebook fell from the #3 spot to #4 while Tmall (8th in 2018) and Sohu (not in top 10 in 2018) both jumped up in the rankings. Four of the sites on this list are exclusive to China, demonstrating the strength of this market.
6.7 million people blog on popular blogging sites like Tumblr, Blogger, and more.
Blogger is the largest blogging platform with over 46 million monthly active users. The majority of bloggers are women.
Currently there are 1,805,260,010 websites online globally.
Every second that a customer has to wait to load a web page increases their likelihood of clicking out. Research shows that as load times go from 1 second to 3 seconds, the likelihood of this occurring increases by 32%. If a page takes 10 seconds to load, the probability increases to 123%.
The average speed of websites in every industry in the United States is 5-6 seconds. But, the best practice according to Google is 3 seconds.
Per minute, there are 750,000 songs streamed on Spotify.
Social Media Statistics
With a current world estimated population of 7.8 billion, there are approximately 4.79 billion people worldwide who have access to and use the internet frequently. That means that 61.4% of the world population uses the internet.
From the year 2000 to 2019, the usage of the internet increased by 1,157%.
As of June 2019, the world region of Asia accounts for the majority of internet users in the world. 2,300,469,859 people in Asia are online, which makes up 50.7% of the global internet population.
89.4% of America and 87.7% of Europe has access to and uses the internet on a daily basis. Both regions have some of the highest internet penetration rates.
Countries in the Middle East have seen a 5,243% growth in internet usage since 2010.
There are currently 351.8 million registered domain names in the world.
35% of all websites are using WordPress as their content management system. That’s over 60 million websites.
The most common domain name extensions are:
.com
.net
.org
.co
.us
https://www.broadbandsearch.net/blog/internet-statistics
In 2019, the number of emails sent and received globally was 293.6 billion per day. By 2022, it’s expected to increase to 333.2 billion emails sent and received per day.
Every minute, Americans generate 3,138,420gb of internet traffic 2019 Internet Traffic Statistics
In 2019, 51.5% of all traffic worldwide was conducted on mobile phone devices. This is slightly lower than the year before, suggesting the trend will settle at around 50 percent of traffic coming from mobile.
In 2009, just 0.7% of internet traffic worldwide was from mobile devices.
64.92% of people browsing the internet are using Google Chrome as their main browser.
15.97% of people browsing the internet are using Safari to do it
4.33% of internet users choose Firefox as their main browser
The top 10 most visited sites on the web in 2019 were:
1. Google
2. YouTube
3. Tmall
4. Facebook
5. Baidu
6. Tencent QQ
7. Sohu
8. Taobao
9. 360.cn
10. Jd.com
As compared to 2018, Google and YouTube remained in the same positions. But Facebook fell from the #3 spot to #4 while Tmall (8th in 2018) and Sohu (not in top 10 in 2018) both jumped up in the rankings. Four of the sites on this list are exclusive to China, demonstrating the strength of this market.
6.7 million people blog on popular blogging sites like Tumblr, Blogger, and more.
Blogger is the largest blogging platform with over 46 million monthly active users. The majority of bloggers are women.
Currently there are 1,805,260,010 websites online globally.
Every second that a customer has to wait to load a web page increases their likelihood of clicking out. Research shows that as load times go from 1 second to 3 seconds, the likelihood of this occurring increases by 32%. If a page takes 10 seconds to load, the probability increases to 123%.
The average speed of websites in every industry in the United States is 5-6 seconds. But, the best practice according to Google is 3 seconds.
Per minute, there are 750,000 songs streamed on Spotify.
Social Media Statistics
 The most popular social media channels in the world are:
Facebook: 2.414 billion active users
Facebook Messenger: 1.3 billion active users
Instagram: 1 billion active users
Twitter: 330 million active users (down from 335 million in
LinkedIn: 310 million active users
SnapChat: 294 million active users
In 2019, there were 3.484 billion social media users around the world.
Facebook is the fourth most visited website in the world.
YouTube was the number one downloaded app globally in 2019.
68% of Americans use Facebook as their primary social media channel, followed by 35% using Instagram, 29% using Pinterest, and 24% on Twitter.
Only 35% of people using Facebook are under 25.
66% of monthly active users on Facebook come back to the platform every day. 74% of American users are found on the platform daily, too.
The average American uses Facebook for nearly 1 hour (58 minutes) every day.
The average session duration on Facebook is between 10 and 12 minutes.
88% of Facebook traffic comes from mobile devices using the Facebook mobile application.
Facebook isn’t just for connecting with friends and family or using Messenger. In fact, 78% of users have used the platform to find new products and services. And, Facebook is the most popular marketing platform of any social media channel for both B2B and B2C businesses.
80% of people using Instagram are outside of the United States.
34% of users are Instagram are in the “Millennial” generation category.
25% of smartphone users have the Instagram application installed on their device.
22% of Instagram accounts login every single day.
38% of all Instagram users will check their application more than once per day.
In a single day on Instagram, 4.2 billion pictures are “liked.” To add to that, there are nearly 100 million new pictures/posts created on Instagram every single day, and 400 million more stories posted. Story feature usage has increased by 100 million posts since 2017.
Every minute, there are 79,740 posts published on Tumblr, 176,220 calls made on Skype, 473,400 tweets sent on Twitter, and 2,083,333 snaps sent on Snapchat.
Video Statistics
There are dozens of streaming platforms worldwide. The most popular video streaming platforms are:
YouTube: 1.8 billion unique monthly visitors
Netflix: 150 million unique monthly visitors
Vimeo: 130 million unique monthly visitors
Yahoo! Screen: 125 million unique monthly visitors
DailyMotion: 100 million unique monthly visitors
Hulu: 75 million unique monthly visitors
45% of people globally watch an hour or more of online video content every single day.
50% of people between the ages of 18 and 34 would drop their current task to watch a new YouTube video from a channel they subscribe to.
40% of Millennials report trusting YouTube for high-quality content. 60% of them stated that videos on the platform have impacted their personality and worldview.
Video is an important part of the buying journey for consumers in the modern world. 50% of people on the internet watch videos and product demos before purchasing anything.
Videos that go over two minutes in length tend to see significant drop-offs in user retention. But, if someone watches more than six minutes of your video, they are likely to stay for the entirety of it.
In the last few years alone, mobile video-based advertising spend has increased by 95%.
More than 50% of content consumed on YouTube is done via mobile devices and the YouTube mobile application.
90% of video views on Twitter are done through their mobile app.
Search Statistics
Google accounts for 87.96 percent of the global search engine market. The rest is divided amongst Bing, Ask, and DuckDuckGo
For mobile search engine market share, Google.com again dominates with 93.2% of usage worldwide.
The top ten most popular search terms in 2019 (sorted by monthly searches) were:
Weather - 24.4 million
Maps - 20.4 million
Translate - 18.3 million
Calculator - 16.2 million
Youtube to MP3 - 13.7 million
Speed Test - 12.6 million
News - 8.25 million
Thesaurus - 6.7 million
Powerball - 5.7 million
Donald Trump - 5.6 million
Some of the top trending search terms in 2019, according to Google, include:
Disney Plus
Avengers: Endgame
People Antonio Brown, Neymar, James Charles, Cameron Boyce Jussie Smollett, and Kevin Hart
News stories/events: Copa America, Rugby World Cup, iPhone 11, India vs. South Africa, and Hurricane Dorian
Google processes over 3.5 billion searches every single day. That’s 1.2 trillion searches each year and 40,000 every second.
In 1999, Google crawlers took an entire month to index 50 million website pages. In 2012, the same task was accomplished in under 60 seconds.
Ecommerce Statistics
In 2018, global ecommerce (online store) sales totaled 653 billion United States dollars.
96% of Americans shop with online stores at least once per year
By 2021, mobile ecommerce sales will account for 72.9% of all online purchases, totaling 3.56 trillion dollars.
Currently, 1 in 4 dollars of ecommerce spending is spent on mobile devices. Toys and hobbies were the number one item categories of purchase. Second was video games, consoles, and accessories.
Ecommerce sales are the largest around the holiday season and weekend days (Saturday, Sunday). According to the latest study, Cyber Monday is the most popular day for ecommerce sales, totaling 7.8 billion dollars of sales in 2018 alone. Black Friday produced 5.9 billion in ecommerce sales in 2018.
Ecommerce is used by billions of people around the world. Here are the top countries for ecommerce users:
China: 1.03 billion people shop online
United States: 259 million people shop online
Brazil: 119 million people shop online
Germany: 64 million people shop online
Mexico: 60 million people shop online
United Kingdom: 53 million people shop online
Despite being the leader of total ecommerce users, the average revenue produced per user in China is only $634. In the United States, the average revenue per ecommerce user is $1,952.
When it comes to the average order value of online shopping (globally), desktop is the winner. Desktop purchases online average at $179.98. Online orders via tablets average at $87. Smartphones and mobile devices have an average order value of $79.33.
Amazon is the number one ecommerce retailer in the United States, accounting for 49.1% of all online shopping. Next, is eBay with 6.6%, followed by Apple, Walmart, The Home Depot, and Best Buy.
Conclusion
The internet and technologies are constantly changing.
Be sure to check back for more as we keep updating this ultimate list of internet statistics and feel free to use them in your own writing, blogs, websites, and more.
By
Erinn Morgan
E-mail: erinn.morgan@broad-bandsearch.net
The most popular social media channels in the world are:
Facebook: 2.414 billion active users
Facebook Messenger: 1.3 billion active users
Instagram: 1 billion active users
Twitter: 330 million active users (down from 335 million in
LinkedIn: 310 million active users
SnapChat: 294 million active users
In 2019, there were 3.484 billion social media users around the world.
Facebook is the fourth most visited website in the world.
YouTube was the number one downloaded app globally in 2019.
68% of Americans use Facebook as their primary social media channel, followed by 35% using Instagram, 29% using Pinterest, and 24% on Twitter.
Only 35% of people using Facebook are under 25.
66% of monthly active users on Facebook come back to the platform every day. 74% of American users are found on the platform daily, too.
The average American uses Facebook for nearly 1 hour (58 minutes) every day.
The average session duration on Facebook is between 10 and 12 minutes.
88% of Facebook traffic comes from mobile devices using the Facebook mobile application.
Facebook isn’t just for connecting with friends and family or using Messenger. In fact, 78% of users have used the platform to find new products and services. And, Facebook is the most popular marketing platform of any social media channel for both B2B and B2C businesses.
80% of people using Instagram are outside of the United States.
34% of users are Instagram are in the “Millennial” generation category.
25% of smartphone users have the Instagram application installed on their device.
22% of Instagram accounts login every single day.
38% of all Instagram users will check their application more than once per day.
In a single day on Instagram, 4.2 billion pictures are “liked.” To add to that, there are nearly 100 million new pictures/posts created on Instagram every single day, and 400 million more stories posted. Story feature usage has increased by 100 million posts since 2017.
Every minute, there are 79,740 posts published on Tumblr, 176,220 calls made on Skype, 473,400 tweets sent on Twitter, and 2,083,333 snaps sent on Snapchat.
Video Statistics
There are dozens of streaming platforms worldwide. The most popular video streaming platforms are:
YouTube: 1.8 billion unique monthly visitors
Netflix: 150 million unique monthly visitors
Vimeo: 130 million unique monthly visitors
Yahoo! Screen: 125 million unique monthly visitors
DailyMotion: 100 million unique monthly visitors
Hulu: 75 million unique monthly visitors
45% of people globally watch an hour or more of online video content every single day.
50% of people between the ages of 18 and 34 would drop their current task to watch a new YouTube video from a channel they subscribe to.
40% of Millennials report trusting YouTube for high-quality content. 60% of them stated that videos on the platform have impacted their personality and worldview.
Video is an important part of the buying journey for consumers in the modern world. 50% of people on the internet watch videos and product demos before purchasing anything.
Videos that go over two minutes in length tend to see significant drop-offs in user retention. But, if someone watches more than six minutes of your video, they are likely to stay for the entirety of it.
In the last few years alone, mobile video-based advertising spend has increased by 95%.
More than 50% of content consumed on YouTube is done via mobile devices and the YouTube mobile application.
90% of video views on Twitter are done through their mobile app.
Search Statistics
Google accounts for 87.96 percent of the global search engine market. The rest is divided amongst Bing, Ask, and DuckDuckGo
For mobile search engine market share, Google.com again dominates with 93.2% of usage worldwide.
The top ten most popular search terms in 2019 (sorted by monthly searches) were:
Weather - 24.4 million
Maps - 20.4 million
Translate - 18.3 million
Calculator - 16.2 million
Youtube to MP3 - 13.7 million
Speed Test - 12.6 million
News - 8.25 million
Thesaurus - 6.7 million
Powerball - 5.7 million
Donald Trump - 5.6 million
Some of the top trending search terms in 2019, according to Google, include:
Disney Plus
Avengers: Endgame
People Antonio Brown, Neymar, James Charles, Cameron Boyce Jussie Smollett, and Kevin Hart
News stories/events: Copa America, Rugby World Cup, iPhone 11, India vs. South Africa, and Hurricane Dorian
Google processes over 3.5 billion searches every single day. That’s 1.2 trillion searches each year and 40,000 every second.
In 1999, Google crawlers took an entire month to index 50 million website pages. In 2012, the same task was accomplished in under 60 seconds.
Ecommerce Statistics
In 2018, global ecommerce (online store) sales totaled 653 billion United States dollars.
96% of Americans shop with online stores at least once per year
By 2021, mobile ecommerce sales will account for 72.9% of all online purchases, totaling 3.56 trillion dollars.
Currently, 1 in 4 dollars of ecommerce spending is spent on mobile devices. Toys and hobbies were the number one item categories of purchase. Second was video games, consoles, and accessories.
Ecommerce sales are the largest around the holiday season and weekend days (Saturday, Sunday). According to the latest study, Cyber Monday is the most popular day for ecommerce sales, totaling 7.8 billion dollars of sales in 2018 alone. Black Friday produced 5.9 billion in ecommerce sales in 2018.
Ecommerce is used by billions of people around the world. Here are the top countries for ecommerce users:
China: 1.03 billion people shop online
United States: 259 million people shop online
Brazil: 119 million people shop online
Germany: 64 million people shop online
Mexico: 60 million people shop online
United Kingdom: 53 million people shop online
Despite being the leader of total ecommerce users, the average revenue produced per user in China is only $634. In the United States, the average revenue per ecommerce user is $1,952.
When it comes to the average order value of online shopping (globally), desktop is the winner. Desktop purchases online average at $179.98. Online orders via tablets average at $87. Smartphones and mobile devices have an average order value of $79.33.
Amazon is the number one ecommerce retailer in the United States, accounting for 49.1% of all online shopping. Next, is eBay with 6.6%, followed by Apple, Walmart, The Home Depot, and Best Buy.
Conclusion
The internet and technologies are constantly changing.
Be sure to check back for more as we keep updating this ultimate list of internet statistics and feel free to use them in your own writing, blogs, websites, and more.
By
Erinn Morgan
E-mail: erinn.morgan@broad-bandsearch.net


